Welcome to our February Homemover Pulse where we take the pulse of the UK property market and give a snapshot of current homemover activity.
UK Property Market 2022
The property market has had a strong start in 2022, with continued rising prices thanks to high demand and low supply of housing stock. Whilst this mismatch of supply and demand is nothing new, there is hope on the horizon with tentative signs of this imbalance evening out during 2022.
New instructions were up 4.3% in January 2022 vs 2021, whilst year-on-year demand fell by 17%. There have also been conjectural reports from estate agencies of high numbers of valuation requests, often the first step in the selling journey. What’s more, the soaring cost of living will also likely dampen the market, reducing buyer demand over the year to help even out the supply and demand balance.
The Current State of the Owner Occupied Property Market
In the chart below, we have broken down key stages of the home buying journey - new instructions, sale agreed and completions - by region of the UK.
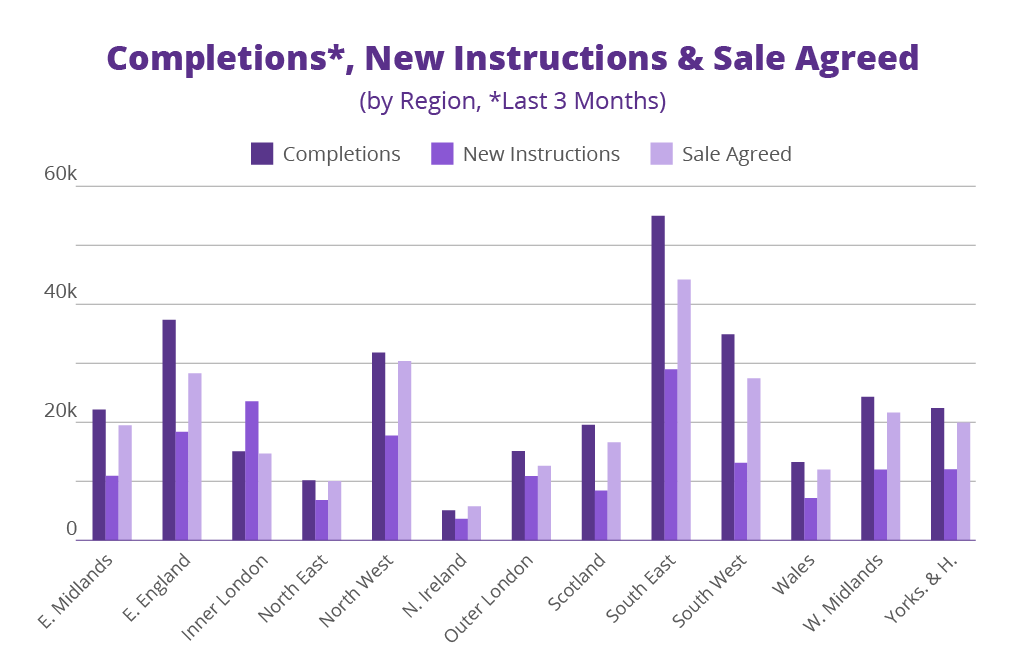
The current state of the property market varies greatly upon area. The popularity of, and activity in, the South East sees no sign of abating, with the region seeing the UK’s highest levels of current new instructions, current houses with a sale agreed, and completions/house moves over the last three months.
At the other end of the scale, the only place in the UK where new instructions are considerably higher than completions over the last three months is Inner London. Whilst there is increased interest in Inner London again as people move back to the office, this shows that the pandemic’s race for space out of the city is not over yet.
Current New Instructions
As we saw in the graph above, the property market trends across the UK are not consistent. Some regions are seeing much stronger levels of new instructions and fresh housing stock than others.
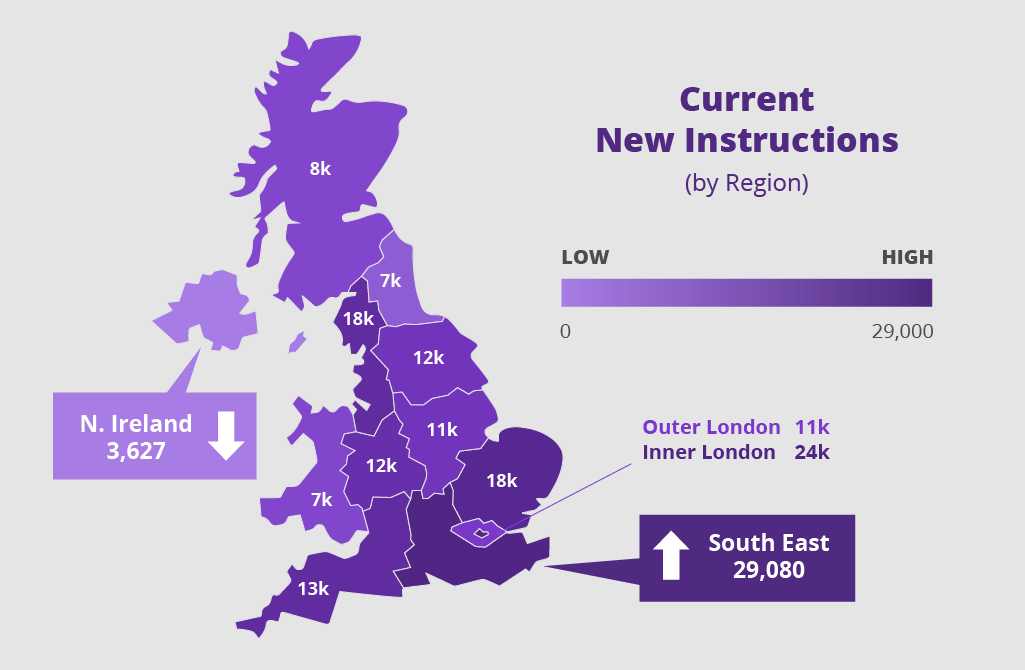
Our new instructions data covers all the properties currently available for sale in the UK. On a national level, new instructions are up 4.3% compared to 2021. Whilst this welcome increase in supply is a definite positive sign, when compared to the last ‘normal’, pre-pandemic year of 2019, new instructions are still down 16.7%.
When looking into new houses for sale by region, the results are cloudier. As the map above shows, you are much more likely to be able to find a new home in Inner London (albeit, most likely a flat) than you are in the South West. Currently, in February 2022, if you’re looking for a new home, you will have the most choice in the South East, Inner London and East of England, closely followed by the North West. You would have to move fast though; at the start of the year, nearly half of properties were listed for sale for under two months and only 18% had been on the market for over six months. This compared to January 2020 when only 16% of properties were for sale for under two months, but 63% were listed for over six months.
If we compare new instructions as a proportion of completions in the last three months to give an idea of supply vs demand, we see a slightly different picture. The South West has the lowest proportional supply available, followed by Scotland, East of England and West Midlands. Only Inner London and the Isle of Man have more properties currently listed for sale than completions in the last three months.
Current Properties With Sale Agreed
Our sales agreed data covers all properties in the UK which are currently at the start of the conveyancing journey and are sold subject to contract.
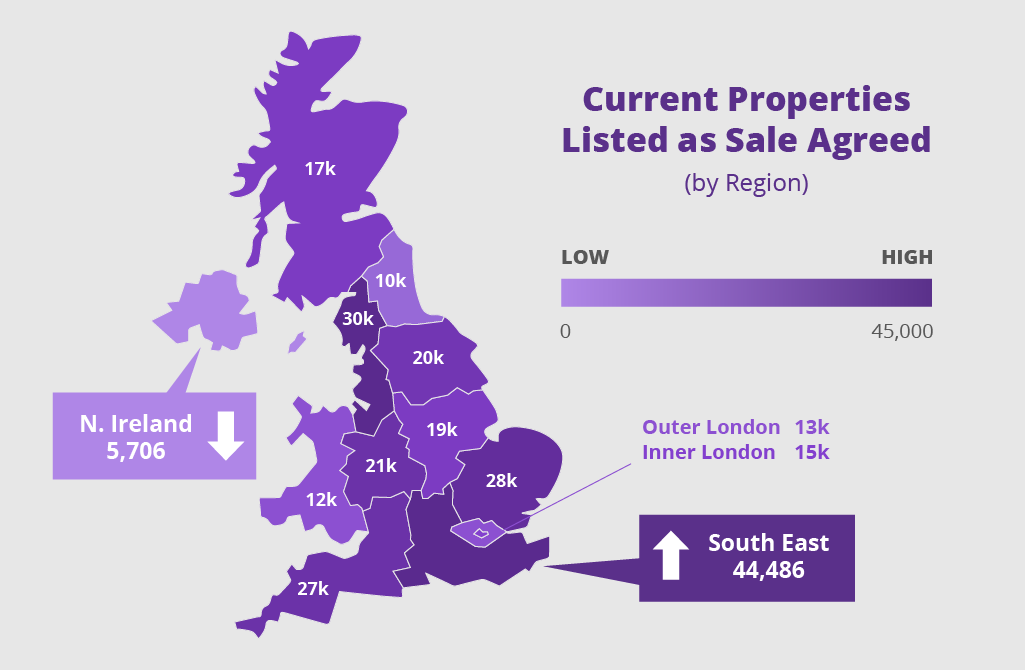
Properties with a sale agreed can be used as a measure of present demand, showing where people are currently in the process of moving to. Perhaps unsurprisingly, the south of England has by far the most current buying activity. The South West and South East combined make up over a quarter of all UK properties that are currently sold subject to contract.
Whilst the South East has the most properties which have sales agreed, regions with the second and third most buying success are the North West and East of England, respectively. These represent regions which have much lower average house prices than the south, and have a lot to offer in terms of space and proximity to swathes of greenery, such as national parks and Areas of Outstanding Natural Beauty (AONBs).
Completions in the Last Three Months
Our completions data covers all properties in the UK which have undergone contract completion in the last three months. This data set, therefore, covers all homes which have been newly purchased and moved into.
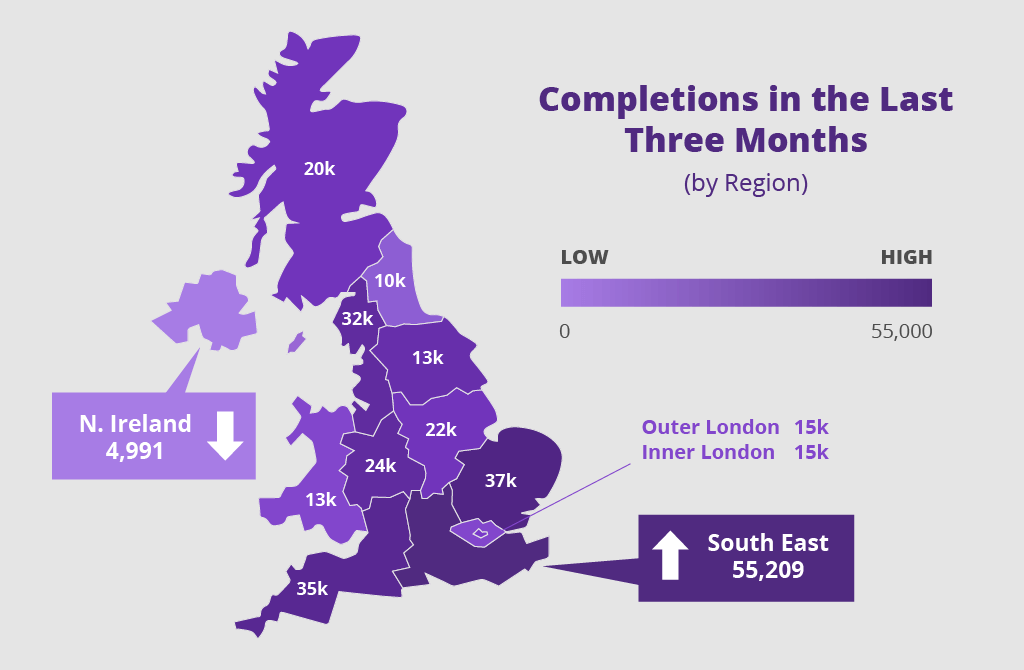
With residential property demand still so high, there have been an incredible 308,380 contract completions in the last three months! The area which has seen by far the highest number of homemovers in the past three months is the South East, with nearly 20,000 more house moves than any other region. Once again, East of England, the South West and the North West take the next few spots with the most moving activity.
This large homemover audience represents a big opportunity for many businesses, including retail, finance, insurance, utilities and more. In the months before and after moving house, people spend on average £42,000 on goods and services related to their move. With 1,534,000 people having moved in 2021, and another 1.1 - 1.2 million owner occupied homemovers forecast for 2022, this is an important and dependable audience to target.
TwentyCi are property and homemover data experts. Our data is unmatched in breadth and depth and offers valuable insights for a range of sectors and categories. If you wish to access our data, or want help in using it to create powerful targeted marketing campaigns, don’t hesitate to contact us.