Welcome to our March Homemover Pulse where we take the pulse of the UK property market and give a snapshot of current homemover activity.
UK Property Market Update - March
The UK property market is still seeing sky-high demand as the mismatch with low supply continues. As a result, average house prices rose again in February for the seventh consecutive month, according to the Nationwide HPI. The price of a typical home in the UK is now over £260,000 for the first time, after a 1.7% month-on-month increase in average cost. This has grown an incredible 12.6% or £29,162 year-on-year, with the supply/demand imbalance in the UK housing market being a large contributing factor to this.
As the cost of living and inflation continue to rise, now compounded by the far-reaching effects of the Russian war on Ukraine, affordability is becoming more of an issue. House price rises are far oustripping wage growth and borrowing costs are starting to increase with inflation, affecting mortgages. This has the potential to have a negative effect on the housing market.
The Current State of the Owner Occupied Property Market
In the chart below, we have broken down key stages of the home buying journey - new instructions, sale agreed and completions - by region of the UK. Currently, there are 172,589 residential properties available for sale and 237,512 properties with sales agreed across the country. There has also been a grand total 290,381 completions in the last three months. 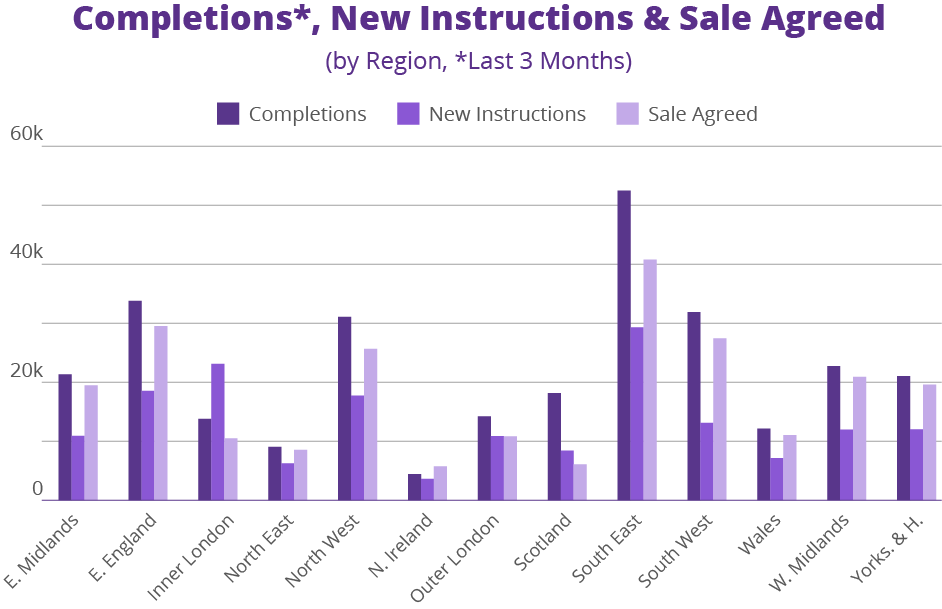
The chart above shows that the South East is still seeing the highest volume of property market activity by far. There have been over 52,000 completions in the last three months, and there are over 70,000 households currently in the moving journey (new instructions and sales agreed). This means new or soon-to-be homemovers make up roughly 3.2% of all households in the South East!
Inner London continues to be the only region where current new instructions are considerably higher than current sales agreed or the number of completions in the last three months. In fact, there are over double the number of properties currently for sale in Inner London than there are properties with sales agreed, at the start of the conveyancing journey.
Current New Instructions
Our new instructions data covers all residential properties in the UK which are currently available for sale. There are currently 172,589 properties listed for sale across the UK.
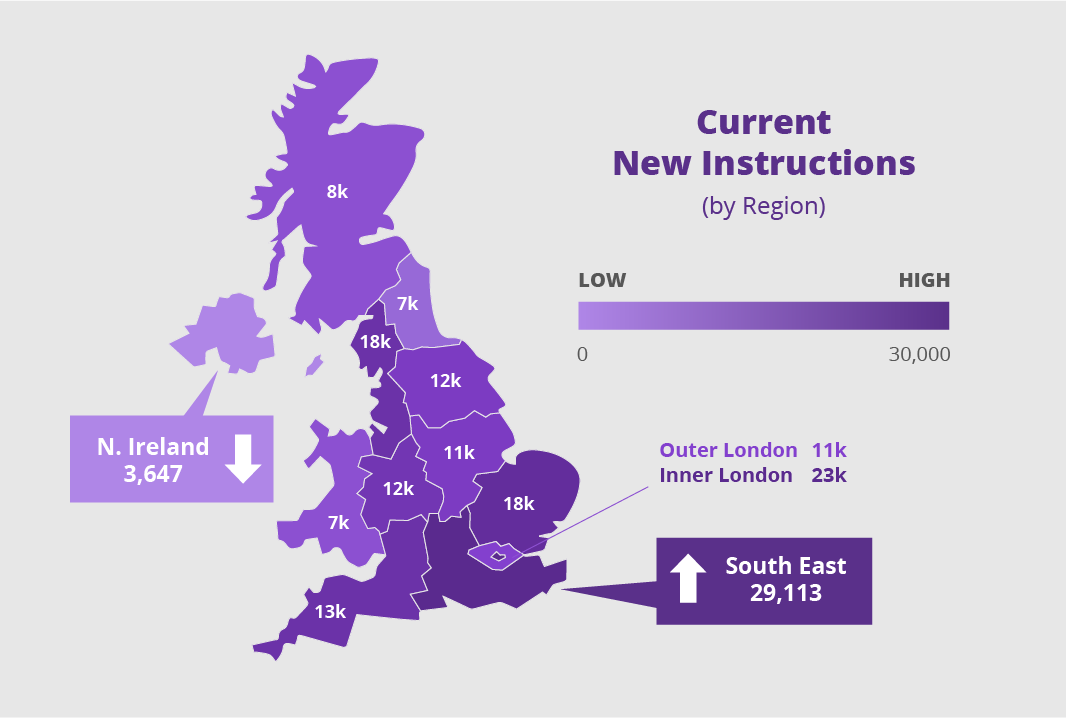
With property supply low in comparison to demand, there is great interest in new instructions and how these compare by region. The London region (inner and outer London combined) has the most new instructions, followed by the South East and the East of England. These rankings are the same when you look at new instructions as a percentage of the total households in each region, too.
By looking at the number of new instructions as a percentage of the number of households in each region, we can see that Scotland is in fact the region with lowest property market activity. Only 0.33% of properties in Scotland are currently available for sale, compared to 1.01% of all properties in London. Scotland has also seen a month-on-month drop of nearly 4% on new instructions.
Current Properties With Sales Agreed
Our sales agreed data covers all properties in the UK which are currently at the start of the conveyancing journey and are sold subject to contract. Sale agreed figures can be seen as an indicator of present demand, showing where people are currently in the process of moving to. Currently, there are 237,512 properties across the UK with sales agreed.
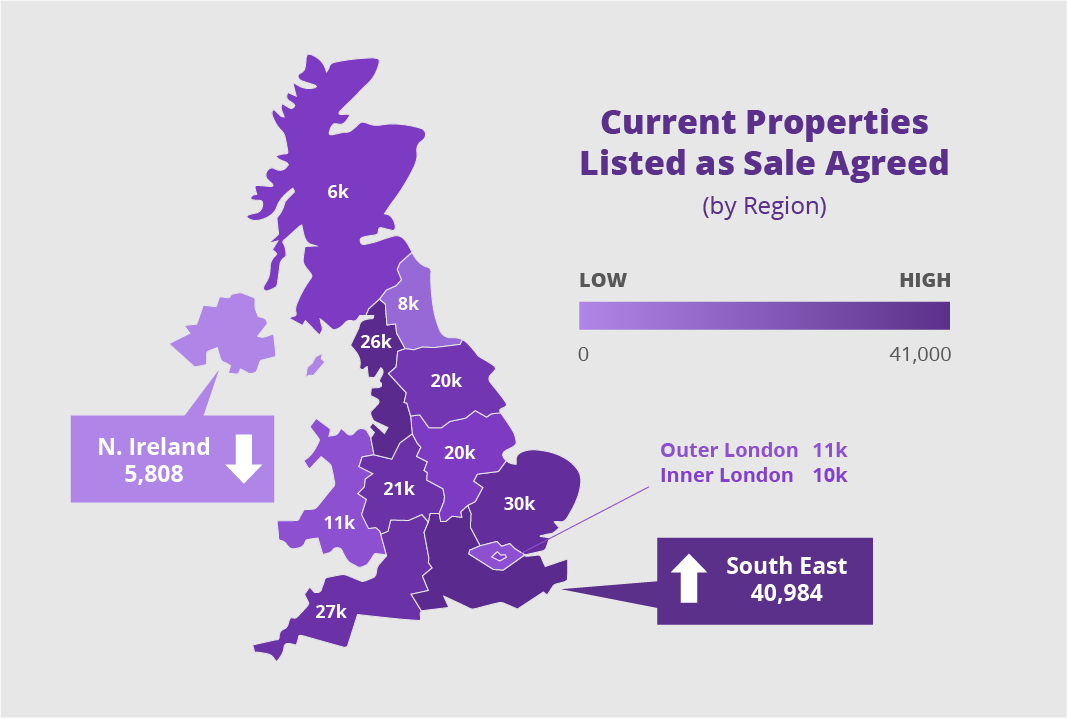
February’s sales agreed were high at 31% above the 2017-19 average for the month. However, our data shows that there are currently 10% fewer properties with sales agreed than there were this time last month in February. Whilst reduced sales agreed figures are partly due to people completing and moving into their new homes, this also suggests a slowing of new sale agreements to replace those who have completed.
In terms of absolute figures, the South East is the region with the most sales currently agreed. This is followed by the East of England and the South West. However, once you account for the different number of households in each region, considering sales agreed figures as a percentage of the region’s total households, we see a slightly different picture. Using this method, the East of England comes out top, followed by the South West and then the South East. In last again, Scotland has by far the lowest proportion of properties in the conveyancing process with sales agreed.
Completions in the Last Three Months
Our completions data covers all residential properties in the UK which have undergone contract completion in the last three months. This data set, therefore, covers all homes which have been newly purchased and moved into.
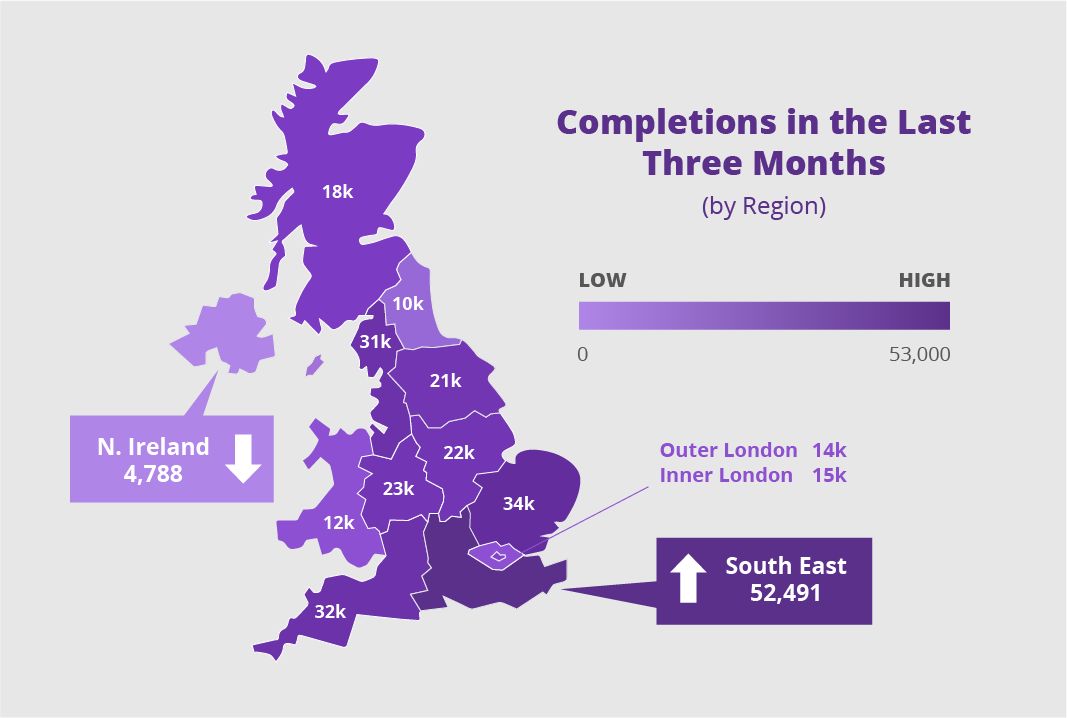
In the three months to March, there have been an impressive 290,381 contract completions across the UK. By both absolute figures and percentages of a region’s total households, the South East, East of England and South West have seen the most contract completions. These three regions and the East Midlands have all seen over 1% of their total households move home in the last three months. Whilst these may look like small percentages, they do in fact represent tens of thousands of homemovers per region.
The homemover audience represents a big opportunity for many businesses, spanning sectors from retail to utilities and insurance. Homemovers spend an average of £42,000 on goods and services related to their move in the months before and after moving house. As property and homemover data experts, TwentyCi can help you tap into this large, high value audience. Get in touch to find out more.