Welcome to our August 2023 Homemover Pulse, where we provide a snapshot of the current UK property market and deliver insights into homemover activity. With the UK’s largest and most sophisticated homemover database, we have unique access to house prices and residential property data at every stage in the purchase journey. Let’s take a look at what is happening this month…
Property Market Summary August 2023
- New instructions: 634,854 – the number of properties currently for sale
- Sold Subject to Contract: 427,027 – the number of properties currently sold subject to contract
- Completions for the last three months: 192,355
UK House Price Growth
The average house price for a property in the UK is £285,044. This is a 2.4% decrease in the average price since last year.
According to the Halifax House Price Index, “Prospects for the UK housing market remain closely linked to the performance of the wider economy. Several factors are providing support, notably strong wage growth, running at around +7% annually.”
The full Halifax Price Index report for July is available here.
Mortgage Insight
The housing market is holding up against the tough economic climate, with the volume of properties For Sale and Sold Subject to Contract remaining consistent month on month. Contrary to the alarmist headlines, the market is not in free fall.
In June, mortgage approvals in the UK surged to their highest point since October 2022. This was driven by buyers rushing to secure home loan agreements ahead of an anticipated rise in interest rates. Contributing factors also include an increase in wage growth, high employment and the availability of longer fixed-rate mortgages.
The Current State of the Owner-Occupied Housing Market: August 2023
At the time of publishing, there were 634,854 newly instructed properties on the market. This is 1,047 fewer than reported in our July Pulse.
There were 1,019 more properties Sold Subject to Contract than in July (427,027 compared to 426,008). There were also 9,671 more properties exchanged in May, June and July (192,355) compared to April, May and June (182,684).
The key stages of the home buying process have been broken down by stages and regions below:
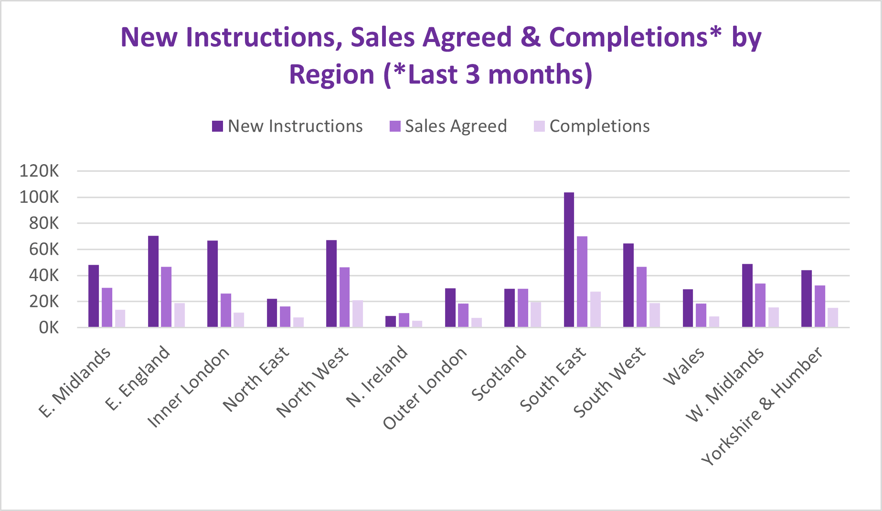
Current New Instructions
Our new instructions data covers all residential properties in the UK that are currently available for sale. At the time of publication, there were 634,854 residential properties available for sale across the UK.
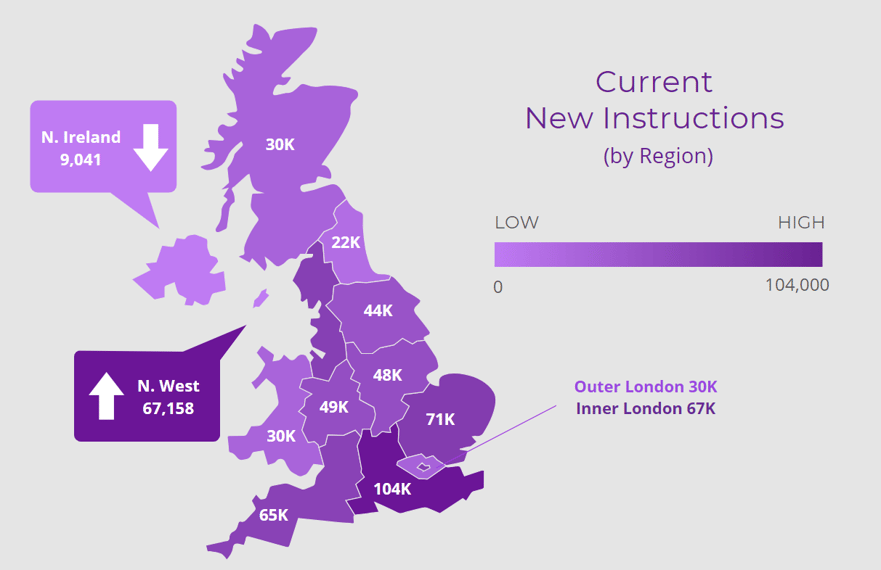
In July, the South East led the way once again, reporting 103,747 available for sale. This was followed by the East of England with 70,597 for sale. The North West surpassed Inner London in July, registering 67,158 for sale, compared to Inner London's 66,856.
Current Properties with Sales Agreed
Our sales agreed data encompasses all UK properties that have been Sold Subject to Contract and are presently undergoing the conveyancing process heading towards completion. These figures can be considered as a gauge of current demand, indicating where people currently are in the moving process.
At the time of publication, 427,027 properties across the UK have sales agreed.
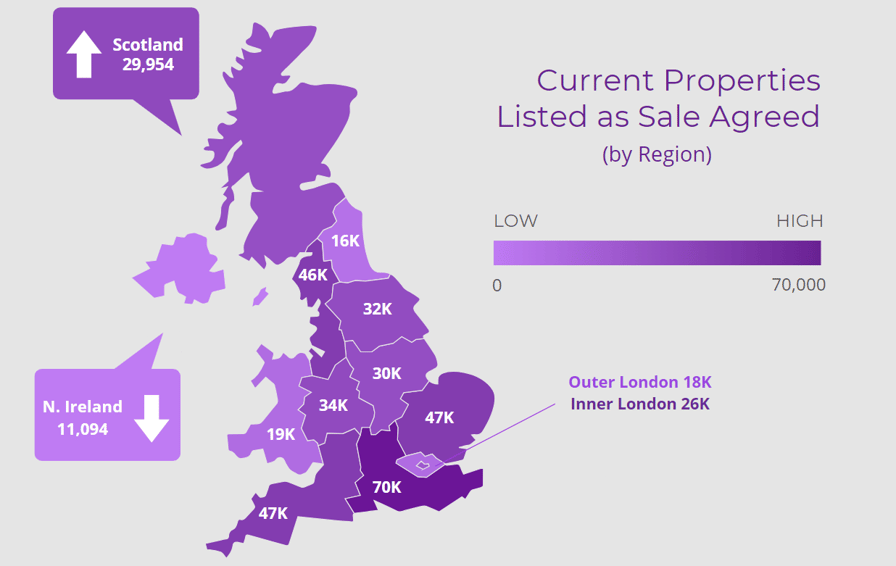
The top five regions with the highest number of properties reported as Sold Subject to Contract are:
- South East – 70,098 compared to 69,660 properties in July
- South West - 46,754 compared to 46,374 properties in July
- East of England - 46,592 compared to 46,381 properties in July
- North West - 46,235 compared to 46,140 properties in July
- West Midlands - 33,995 compared to 34,100 properties in July
All the above-listed regions have seen more properties Sold Subject to Contract compared to the previous month apart from West Midlands which saw a slight decline.
Completions in the Last Three Months
The completions data we provide includes all UK residential properties that have undergone contract completion within the past three months. Thus, this dataset encompasses all homes that have been newly purchased and moved into. For the three-month period ending August 2023, there have been 192,355 contract completions across the UK.
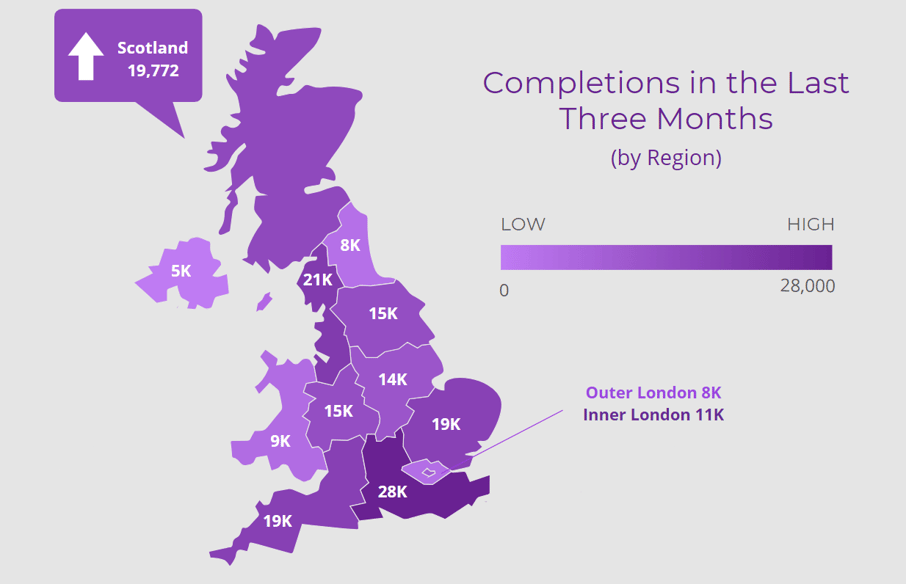
The volume of exchanges in the last 3 months has increased by 5% compared to the previous 3-month period, with 9,671 more property sales completed.
The South East continues to be the highest-performing region with 27,798 property completions recorded. The second-highest performer was the North West, with 21,074 completions. Scotland saw the biggest jump, with a 12% rise in completions in May, June and July compared to April, May and June.
Colin Bradshaw, CEO, TwentyCi observed -
“So far, the UK housing market is remaining stubbornly resistant to collapsing despite some commentators’ worst predictions. Clearly, the strength of the housing market is inextricably linked to the health of the general economy and whist this faces uncertainty so does housing. However, the supply side shortage still exists, abundantly so in the rentals sector, and demand still exists, and properties are still transacting so let’s not all run for the hills just yet.”