Welcome to our December 2022 Homemover Pulse where we take the pulse of the present UK property market and give a snapshot of current homemover activity.
With the UK’s largest and most sophisticated homemover database, we have unique access to data on house prices and residential property at every stage in the purchase journey. Here’s the latest update on the UK’s housing market.
Property Market Summary December 2022
- New Instructions: 373,151 new instructions, a growth of +3.04% in comparison with last month.
- Sales Agreed: 261,560 sales agreed, a fall of -9.21% in comparison with last month.
- Completions: 276,626 completions, a growth of +9.88% in comparison with last month.
UK House Price Growth
A typical property in the UK currently costs £285,579 to purchase. This has fallen slightly compared to last month, making it the third month in a row where prices have dropped.
This drop is a further normalisation of the erratic rise in house prices observed during the Covid-19 pandemic, which brought with it some of the largest spikes seen in the housing market according to the latest Halifax Price Index Report.
The full report is available here.
The current state of the owner-occupied housing market: November 2022
Across the country, there are 373,151 properties on the market and 261,560 properties that are sold subject to the contract (SSTC). The last three months have seen 276,626 exchanges taking place.
In the chart below, we have broken down these key stages of the home buying journey - new instructions, sale agreed and completions - by region of the UK.
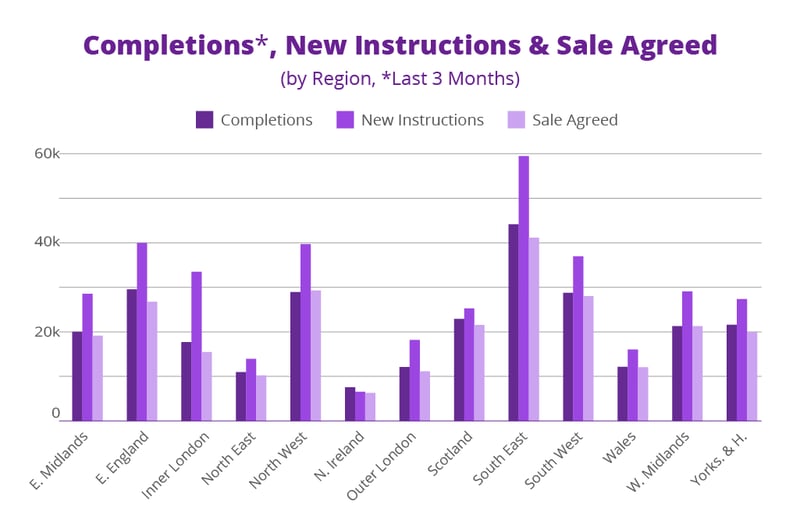
The most activity regarding new instructions is largely taking place in the South East of London, followed by the East and North West of England. This follows the same trend that was highlighted in the Pulse report in November.
Due to the sporadic activity in the housing market caused by the pandemic, the best benchmark to measure the market by is the pre-pandemic period of 2019. With that in mind, new instructions rose by +3.04%
Current new instructions
Our new instructions data covers all residential properties in the UK that are currently available for sale. There are 373,151 properties listed for sale across the UK at present.
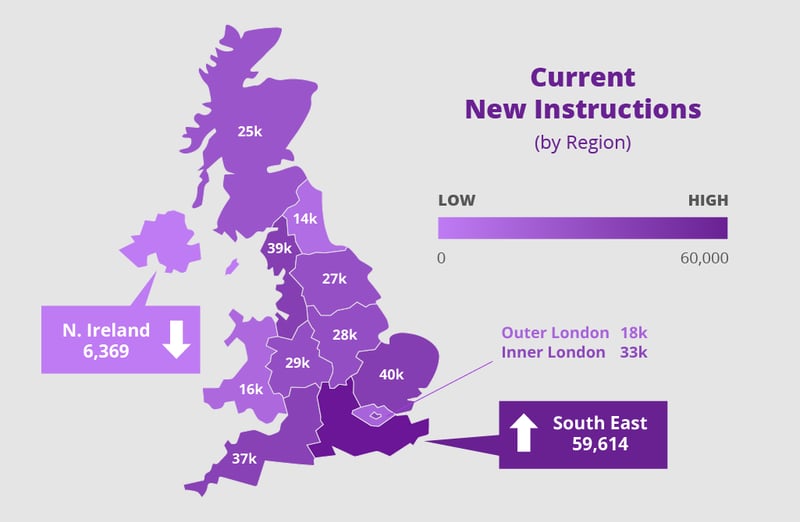
The South East is the busiest in regards to new instructions followed by inner and outer London combined.
Compared with 2019, there has been a boost in new instructions in:
- The East Midlands - 1,004 more instructions
- East of England - 498 more instructions
- Inner London - 7,157 more instructions
- North West - 813 more instructions
- Outer London - 1,928 more instructions
- Scotland - 386 more instructions
- South West - 259 more instructions
- Wales - 1,327 more instructions
- Yorkshire and the Humber - 774 more instructions
The greatest increase has been observed in Inner London, which has seen a +27.36% rise in new instructions. This is followed by Outer London, with +11.79% more new instructions compared to 2019.
Current properties with sales agreed
Our sales agreed data covers all properties in the UK which are currently at the start of the conveyancing journey and are sold subject to contract. Sale agreed figures can be seen as an indicator of present demand, showing where people are currently in the process of moving. Currently, 315,777 properties across the UK are sales agreed.
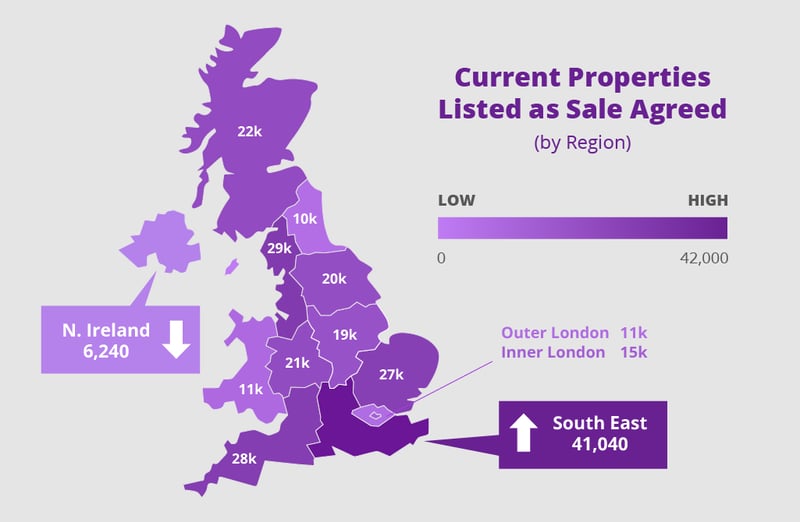
Once again, the South East is seeing the most activity regarding properties sold subject to contract.
Compared to 2019, the number of properties that have been sold has not yet fully recovered. Only the North East is currently outperforming the same period in 2019, with a marginal -0.13% increase.
This shows that demand for properties may be cooling after the sharp incline during the pandemic and potentially in response to the Cost of Living Crisis and mortgage interest rate fluctuations.
Completions in the last three months
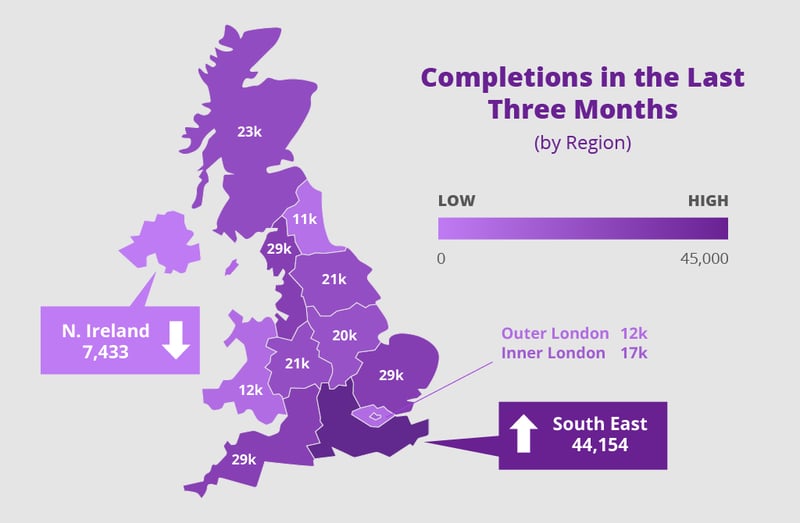
Completions in the three months to December 2022 were -0.34% lower than in the 3 months to November. However, comparative to 2019, there was a healthy growth of +9.88%
The greatest increase was seen in the South East, which saw a +14.10% increase in completions in the last three months compared to 2019. This second largest increase was closely seen in Inner London, with a +31.09% increase in the same period.
The only area that has not seen an increase in property contract exchanges when compared with 2019 was the West Midlands, which fell by -0.89%
Whilst we are seeing a normalisation in the property market, that doesn’t mean that opportunities do not exist. Homemovers are demonstrably still a strong audience for various sectors, from home retailers to utility providers and insurance companies.
The consumer buying behaviour insights available from us can help businesses tap into vital information that will assist in positioning your brand in the right place, at the right time for improved return on investment and marketing effectiveness.