Homemover Pulse: UK Property Market February 2023
Welcome to our February 2023 Homemover Pulse where we take the pulse of the present UK property market and give a snapshot of current homemover activity.
With the UK’s largest and most sophisticated homemover database, we have unique access to data on house prices and residential property at every stage in the purchase journey. Here’s the latest update on the UK’s housing market.
Property Market Summary February 2023
- New Instructions: 529,085 new instructions compared to 403,646last year.
- Sold Subject to Contract: 351,612 completions compared to 465,410 last year.
- Completions in the last three months: 246,193 completions.
UK House Price Growth
The average house price for a property in the UK is currently £281,684 a 1.9% increase since last year.
According to the Halifax House Price Index, the monthly change has continued to rise since November 2022, however looking at things from a 3-month on 3-month percentage change perspective, there continues to be a dip.
The full report is available here.
The current state of the owner-occupied housing market: February 2023
529,085 properties are currently on the market across the UK and 351,612 properties are sold subject to contract (SSTC).
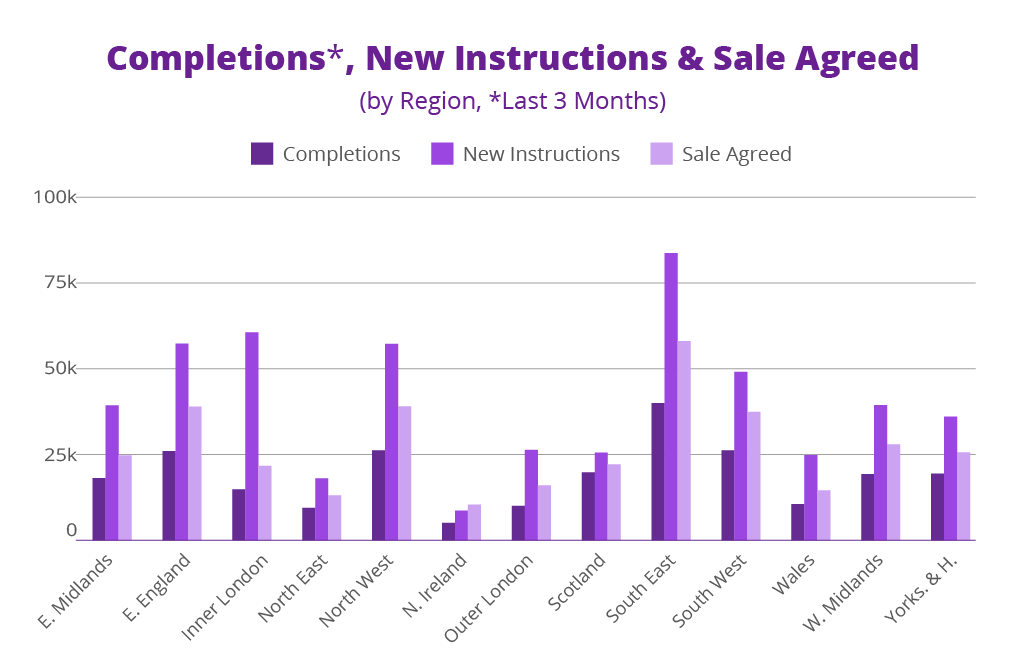
Below, the key stages of the home buying process have been broken down by stages and region.

Nick McConnell, Commercial Director at TwentyCi says of the latest data:
“The demand for residential property in London and the Southeast continues. According to a report by IPPR North, almost half of England’s increase in jobs over the past decade has been in these areas. The report highlighted that London benefited from a net increase of more than 1.2m jobs between 2009 and 2019 representing 32 per cent of England’s total net increase of 3.8m even though it has 16 per cent of England’s population. In contrast, the Northeast netted 1 per cent of the rise in net jobs despite having 5 per cent of England’s population.”
Current new instructions
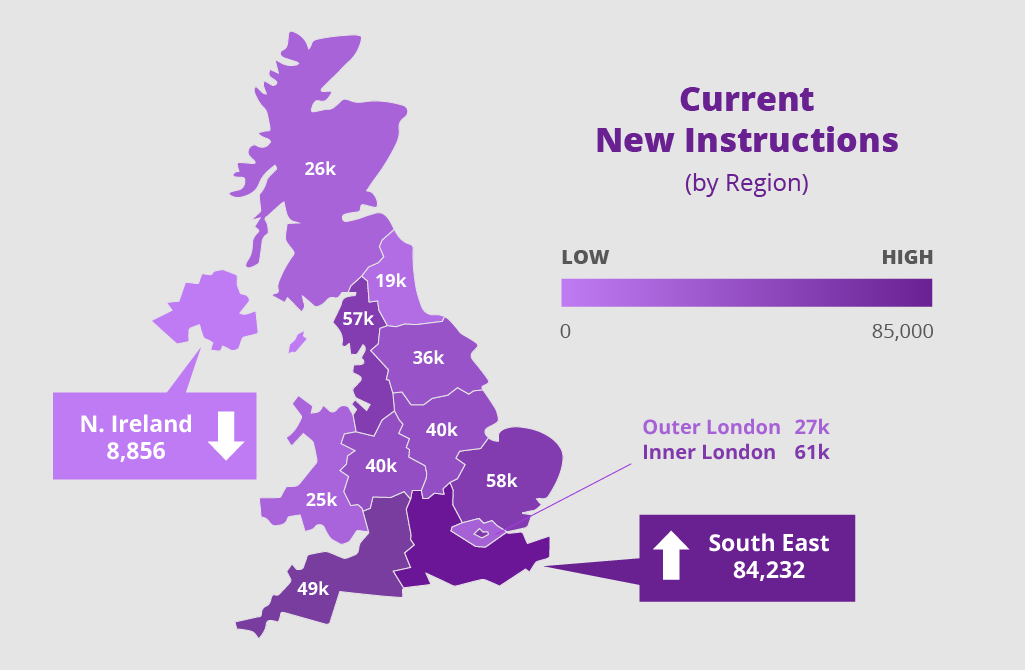
Our new instructions data covers all residential properties in the UK that are currently available for sale. At the time of publication, there were 529,085 residential properties available for sale across the UK.

As has been the case for the past few months, the South East continues to dominate in regard to new instructions, with 84,232 new properties coming onto the market. Inner London was the second busiest, with 60,763 new instructions, closely followed by the East of England and the North West with 57,572 and 57,349 new instructions respectively.
The regions with the least amount of properties coming onto the market are Northern Ireland, with 8,856 new instructions and the North East with 18,502 new instructions.
Current properties with sales agreed
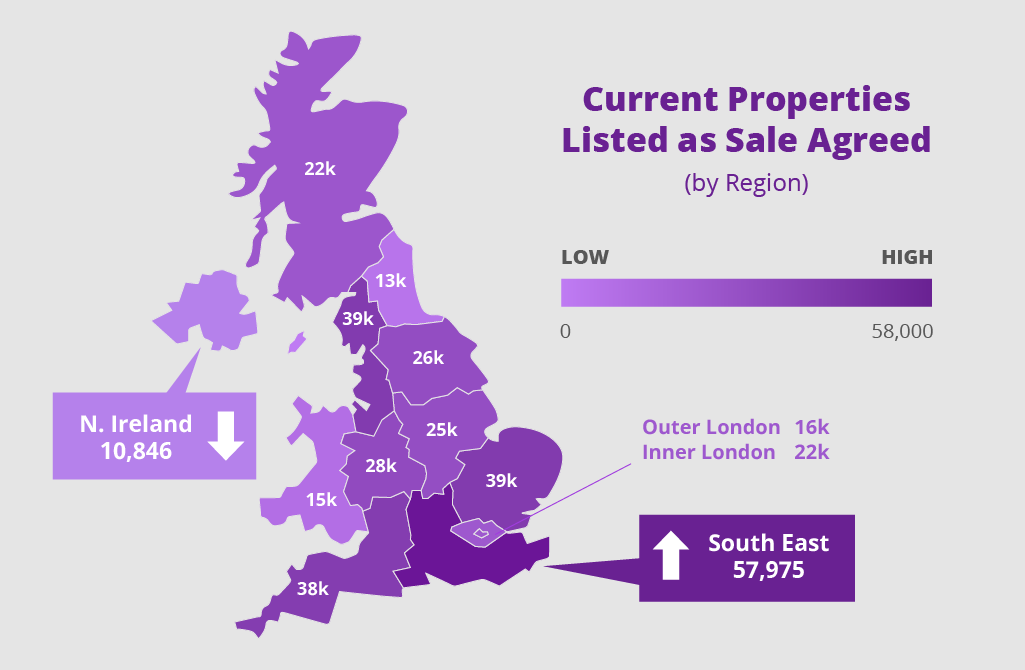
Our sales agreed data covers all properties in the UK which are sold subject to contract and currently in the conveyancing journey heading to completion. Sale agreed figures can be seen as an indicator of present demand, showing where people are currently in the process of moving. At the time of publication, there are 351,612 properties across the UK that are sales agreed.

Once again the South East dominates with 57,975 properties sold subject to contract. The East of England and the North West are the second and third most popular, with 39,237 and 38,838 properties sales agreed respectively.
The regions with the least number of properties sold subject to contract are Northern Ireland, with 10,846 properties sold subject and the North East with 13,303 properties at the sales agreed stage of the sales journey.
Completions in the last three months
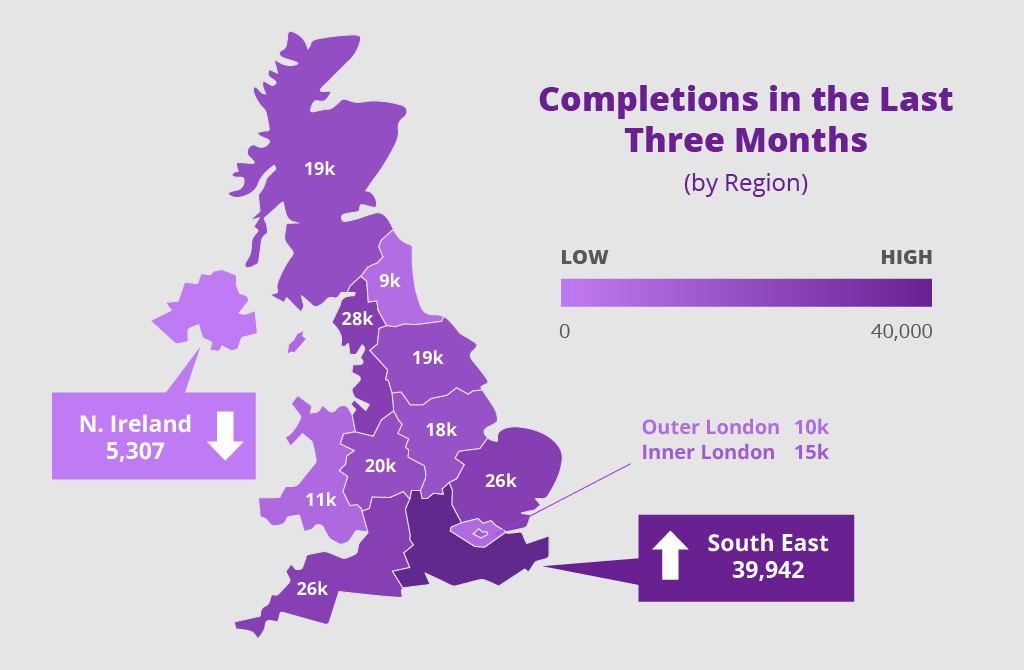
Our completions data covers all residential properties in the UK which have undergone contract completion in the last three months. This data set, therefore, covers all homes which have been newly purchased and moved into. In the three months to February 2023, there have been 246,193 contract completions across the UK.

The region with the greatest number of contract completions, once again, took place in the South East, with 39,942 completions. This was followed by the North West, with 26,168 completions, the East of England, with 26,152 completions and the South West, with 26,076 completions.
Northern Ireland had the least activity in the last three months, with 5,307 completions, followed by the North East with 9,652 completions in the last three months.
Properties coming onto the market are not as high as this time last year, however, February has seen more instructions compared to last month continuing a strong start to 2023.