Welcome to our October 2022 Homemover Pulse where we take the pulse of the present UK property market and give a snapshot of current homemover activity.
With the UK’s largest and most sophisticated homemover database, we have unique access to data on house prices and residential property at every stage in the purchase journey. Here’s the latest update on the UK’s housing market.
Property Market Summary October 2022
- House Price Growth: the annual growth rate is slowing, but the average asking price is still high at 23% more than in the same period in 2019.
- New Instructions: 263,359 new instructions, a growth of 8.75% in comparison with last month.
- Sales Agreed: 315,777 sales agreed, a decline of 3.62% in comparison with last month.
- Completions: 307,190 completions, an increase of 1.10% in comparison with last month - but with Scotland clearly skewing these figures to appear in a more positive light.
UK House Price Growth
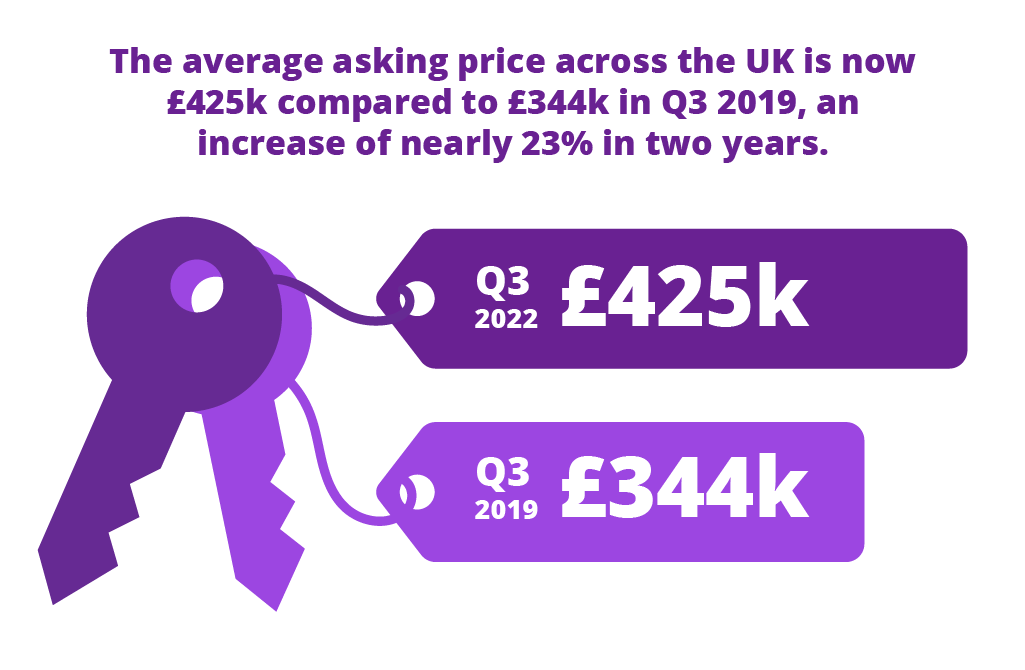
The average asking price across the UK is now £425k compared to £344k in Q3 2019, an increase of nearly 23% in two years.
The latest Halifax house price index reports that the ‘standardised’ average price for a home in the UK has decreased marginally.
You can read the full report here.
This is the second month this year that average house prices decreased. Average UK house prices are steadying, as is the pace of annual growth.
The current state of the owner-occupied housing market: October 2022
Currently, there are 263,359 residential properties available for sale and 315,777 properties with sales agreed upon across the country. There have also been 307,427 completions in the last three months. In the chart below, we have broken down these key stages of the home buying journey - new instructions, sale agreed and completions - by region of the UK.
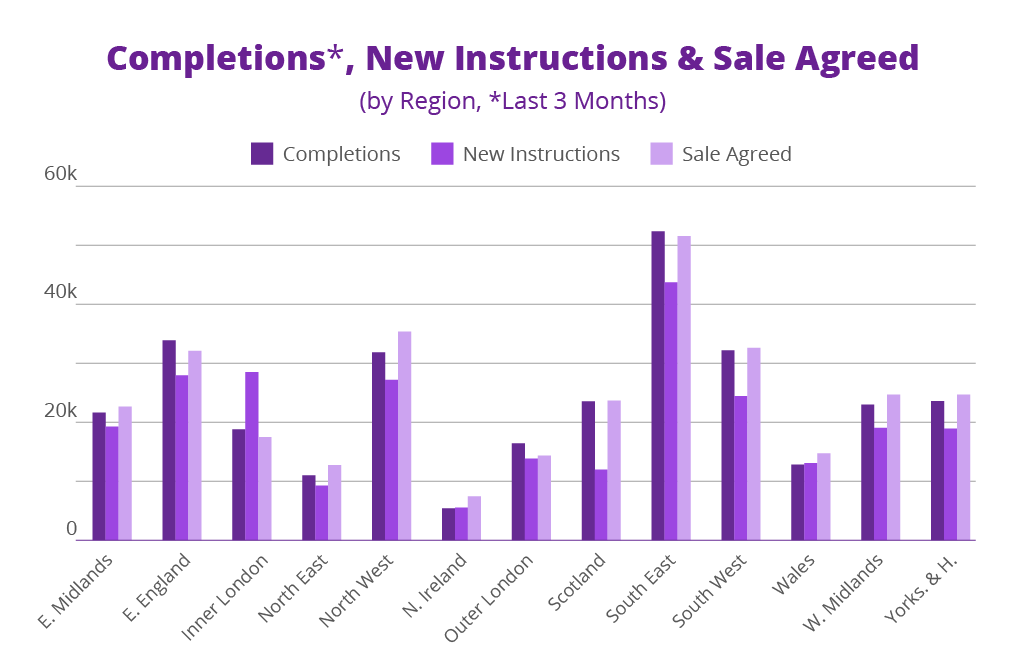
October has brought an increase in new instructions compared with last month, further increasing the property stock currently on the market. Sales agreed decreased in comparison with September, and completions saw a slight increase.
After September’s mini-budget repercussions on the housing market are to be anticipated. With higher mortgage borrowing costs and pressures on the cost of living, there is the potential for a recalibration of the residential property market.
Current new instructions
Our new instructions data covers all residential properties in the UK that are currently available for sale. There are currently 263,359 properties listed for sale across the UK.
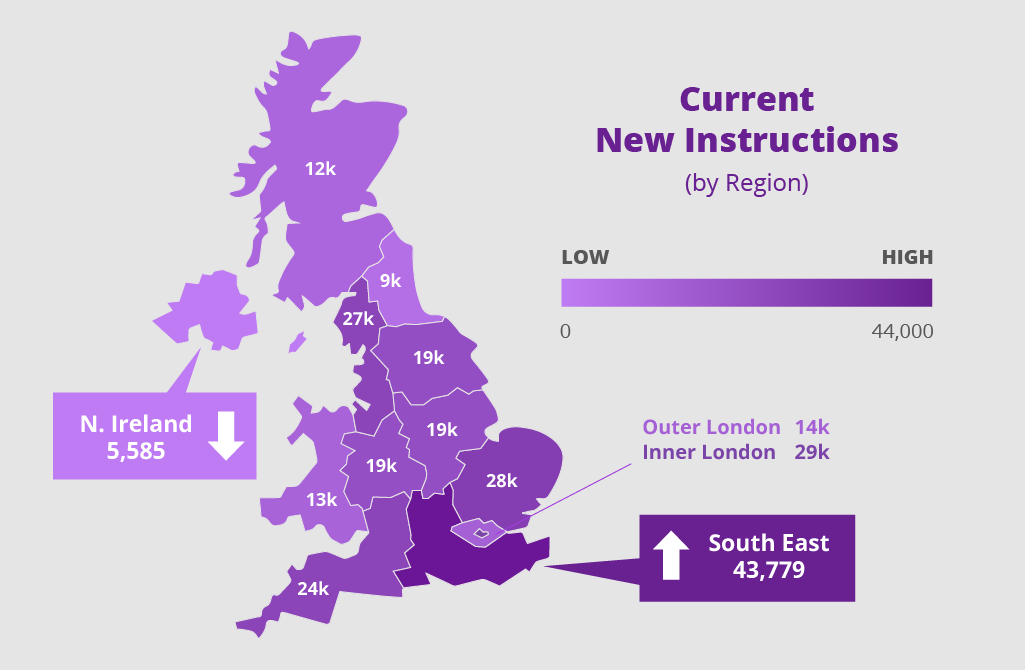
This further property supply boost will help to take the pressure off the seller’s market that has been driving property prices upward for some time. Home movers have the luxury of more choice but with annual house price growth and a chaotic mortgage market, can they really afford it?
New instructions increased in all regions compared with last month. Northern Ireland’s growth was very slight with just 0.14%, but all other regions had a minimum of 5% increased new instructions since September’s homemover pulse. However, as Northern Ireland’s sales agreed increased so much last month, this is unsurprising.
Current properties with sales agreed
Our sales agreed data covers all properties in the UK which are currently at the start of the conveyancing journey and are sold subject to contract. Sale agreed figures can be seen as an indicator of present demand, showing where people are currently in the process of moving to. Currently, there are 315,777 properties across the UK with sales agreed.
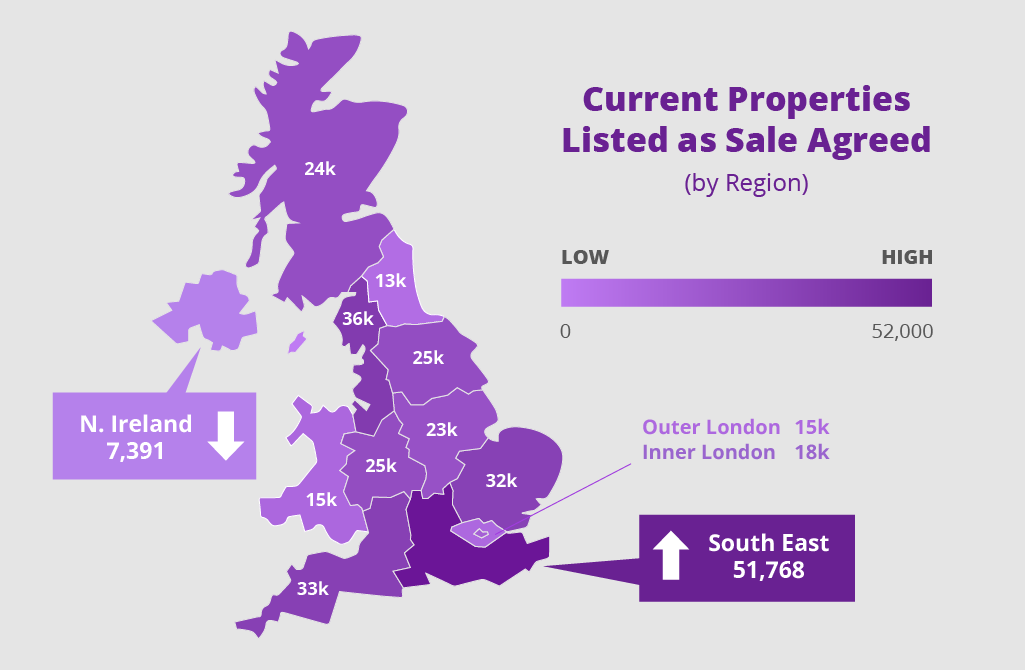
As the cost of living continues to rise and a period of greater economic uncertainty takes hold, buyer demand remains on a downward trend. Overall SSTC figures are 3.61% down on last month’s total.
Once again, Scotland was the only region to demonstrate a slight increase in demand compared with last month. The biggest downturns in demand were found in the East Midlands, at 5.67% less than last month, and outer London with 5.53% less than in September.
In the South East, we’ve seen completion numbers overtake sales agreed for the first time since March, a clear sign that demand is on the wane and the tide is turning in the UK’s housing market.
Completions in the last three months
Our completions data covers all residential properties in the UK which have undergone contract completion in the last three months. This data set, therefore, covers all homes which have been newly purchased and moved into. In the three months to October, there have been 307,427 contract completions across the UK.
This month, completions in the three months to October 2022 were +1.18% higher than in the 3 months to September. With rising mortgage rates, buyers are undoubtedly keen to help sales progress to secure pre-agreed rates. We’ll have a keen eye on these figures to see how things play out over a more sustained period.
Scotland was a clear outlier with an +18.94% increase in completions. Inner London was also strong with a +6.10% increase. These two regions skew the overall picture somewhat.
In reality, almost 50% of UK regions experienced a decline in completions in comparison with the figures we reported last month, and a further 15% of UK regions had an increase of under 0.1%. If we remove Scotland from the picture, the overall number of completions for the rest of the UK comes in at a fraction less than we reported in September.
There’s undoubtedly a change in the direction of the UK housing market which has consistently defied expectations for many months. With interest rates expected to continue to rise sharply amid these uncertain times, we expect to see slower growth in the market over the coming months.
The homemover audience represents a large opportunity for many businesses, from the retail sector to utilities and insurance. Homemovers spend an average of £42,000 on goods and services related to their move in the months before and after moving house. As property and homemover data experts, TwentyCi can help you tap into this large, high-value audience. Get in touch to find out more