We have widely reported the recent insatiable demand for property brought about by a combination of pent-up demand from the pandemic, stamp duty holidays and the underlying strength of the economy, or at least the strength of the sections of the economy that are able to buy property.
In this edition, we take a look at where the demand is coming from. Note that we measure demand in the housing market by focusing on the volume of sales agreed on properties which are on the market.
Growth Share Matrices
Having spent a number of years in managerial and board level roles, I am familiar with the theory of business strategy as well as the practice.
One of my favoured tools is the BCG Growth Share matrix, which although created in 1970, if used properly, still holds weight today.
This week, we will adapt the BCG matrix to look at the growth / share of sales agreed by region.
At all times we will look at the share of the market in 2021 to-date. Because 2020 was so volatile, it makes sense to measure any growth by comparing 2021 to-date with an equivalent time period in 2019.
With the background analysis points over, let’s get on with sharing what we have discovered.
Regional Demand
The growth share of sales agreed by UK region is shown below; 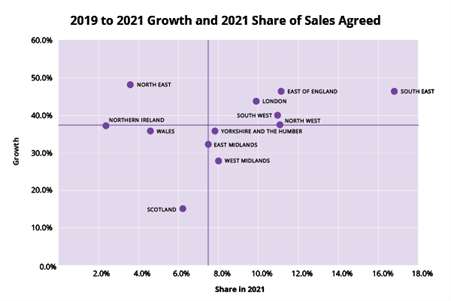
Note that the horizontal and vertical lines represent the average share and the average growth respectively.
If we begin by looking at the best performing quadrant for property demand in the top right-hand corner, we can clearly see that the South of the UK has been the most impressive, with a higher than average growth but also with a larger share of the total market.
In particular, it is worth pointing out the South East region, which has the highest share of the market of any region at nearly 17% and still managing to grow agreed sales by in excess of 47%, which is a compound annual growth rate (CAGR) of over 21%.
It is also worth highlighting that although initial demand in London was sluggish as a result of the rush to get out of the city because of the pandemic, we can certainly say that it has bounced back stronger in 2021.
Although the Midlands, Yorkshire and the North West experienced lower than average growth, their performance in terms of sales agreed growth is still good, being just below average in most cases, and we have to remember that their share of the total market is comparatively high.
The North East is the "question mark". They have a low share of the market, but they actually experienced the highest growth in demand above any region of the UK.
Scotland has by far the lowest growth in the UK at 15% (or a CAGR of only 7.4%). In part, this is down to the ending of the stamp duty holiday to the original timetable, but we also have to remember that their share of the market is relatively low.
For more insight into the UK property market, sign up to our weekly client briefings, where we bring you the latest news and analysis straight to your inbox. Otherwise, join us again for Part 2, where we'll be looking at demand by property type and demand by price band.