
We’ve already seen homemovers peak in June with 213,000 property transactions – nearly 100% higher than historic norms. With this came free-flowing footfall into stores, especially after non-essential retail fully re-opened on 12th April, meaning that marketers didn’t need to invest in marketing as they had more incoming prospects than they could effectively deal with. This is all about to change as we enter the last quarter of the year, and it will become important again to target customers who are more likely to convert (and spend more) so that the best returns are achieved from your marketing spend.
Effects of the 2016 Stamp Duty Surcharge
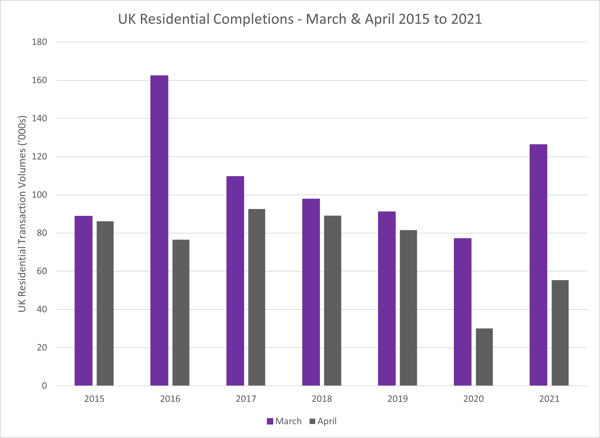
Prior to 2020, before national lockdowns and empty shelves, the last significant change to stamp duty was implemented on 1st April 2016. This was the additional surcharge to second-home owners, landlords of buy-to-let properties, and properties purchased under a company. Why are we talking about this again? Well, history has shown us that an event such as a change in stamp duty like that which was seen in 2016, will cause a rush of completions before the deadline, followed by a lull in the following months.
The below chart shows the phenomenal spike in property transactions in March 2016 as home buyers, estate agents and conveyancers worked hard to complete transactions prior to the deadline. What followed in April 2016 is clearly shown as an underperforming month, where transactions for the month would have been expected to exceed 80,000.
The Remainder of 2021 & Into 2022
Bringing us back to today, the focus of this briefing is looking at the landscape as we see it to suggest how the rest of the year will conclude. Crystal balls are currently out of stock on Amazon, so TwentyCi homemover triggers will have to suffice to gauge a direction for homemovers in Q4 2021. Please note we are not forecasters, but data analysts and we are extrapolating trends here.
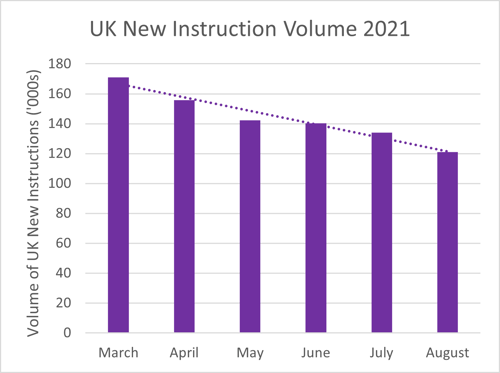
Looking at the volume of new instructions coming to market over the last 3 months, they are in a downward trajectory. Although this is typical for this time of year as we observe a similar trend in 2017, 2018 and 2019, 2021 however does show to have more momentum in its decline, as August instructions have not been this low over the last 6 years at least. With less stock coming to market, this supply shortage will have an impact on the property market which is best measured once we have a view of demand (sales agreed). The graph below shows the downward trajectory over the last 6 months in properties being listed for sale.
The Property Landscape Today - Demand
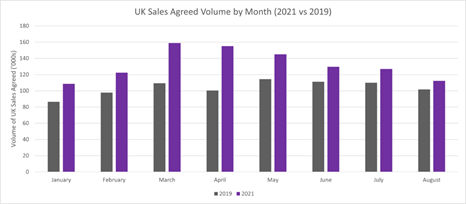
Since March 2021 we have seen the volume of sales agreed reduce gradually, which provides an indication of future transaction levels as these property purchases complete.
In the chart below, the uplift in 2021 demand levels is evident in each month compared to the last “normal” year, with March 2021 showing the highest month of 159,000 sales agreed.
Although the latest figures show August 2021 is still 11% up on 2019, the trajectory of sales agreed is falling, at a faster rate than that seen in 2019. August 2021 volume is 29% down on March 2021, whereas in 2019 this 6-month drop was only 7%. This means that demand levels are returning to normal levels, which is expected.
What are experts saying about the property market for the remainder of 2021?
To verify what we’re forecasting we have looked at external sources in the property market to see what experts are saying about the likely changes we’re going to see in the remainder of 2021.
Savills are forecasting that transactions levels will diminish gradually over the remainder of the year.
IMRG have reported a decline in online sales, primarily driven by multichannel retailers, rather than online-only retailers.
In Zoopla’s House Price Index report, they’ve forecasted that the lack of available properties means the market will slow down during the rest of the year, whilst buyers wait for more suitable properties to become available.
Closing remarks – what does this really mean for retailers?
Put simply, with the volume of homemovers starting to return to a pre-pandemic level, as will the flow of footfall into stores. This means that marketing programmes need to be re-evaluated now so that retailers start to warm up their likely customers for Q4. With homemovers being a key audience for many retailers, talk to us to plan your Q4 activity.
We can help you to build a marketing programme to make the best of your available budget. Get in touch with us today to leverage our data for your success.