Recently, TwentyCi have been looking at where specifically the demand is coming from in the UK property market. In our previous edition, we looked at demand by region, and this week we look at demand by property type and demand by price bands. We have done this by applying the BCG Growth Share Matrix approach to the analysis. Note that we measure demand in the housing market by focusing on the volume of sales agreed on properties which are on the market. At all times we will look at the share of the market in 2021 to-date. Because 2020 was so volatile, it makes sense to measure any growth by comparing 2021 to-date with an equivalent time period in 2019.
Demand by Property Type
The growth share of sales agreed by property type is shown below: 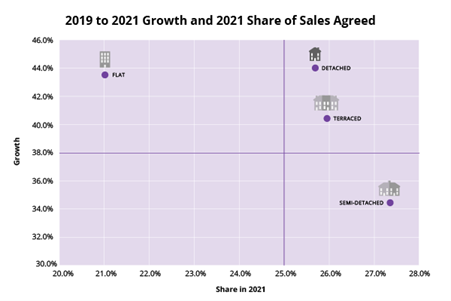
The growth of demand for detached houses and flats has been much greater in 2021 to-date than in 2019. They both have compound annual growth rates of 20% per annum.
Although semi-detached properties have the largest share of the market, their growth is 4% points off the average and c.10% points off of detached properties.
Demand by House Price Bands
The growth share of sales agreed by price band is shown below: 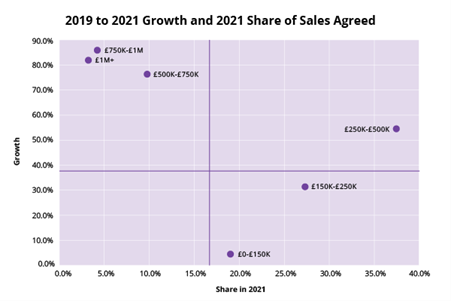
It is quite clear that the highest levels of demand growth have been experienced by the highest priced properties. Where properties above £750k have an 83% growth rate. Even with this high growth, they only occupy 6% of the market in 2021.
Relative growth in the lowest priced bracket of £0-150k has been much slower than average, with growth rates since 2019 struggling at 4%.
The highest share is reserved for £250k-£500k properties and these have also had above average and exceptional demand growth rates.
We continue to comment that it will be interesting to see how far into 2021 this level of demand for property sustains, not least because of the relative lack of supply volumes. However, what the analysis above clearly displays is that it is those that can afford higher value properties who are driving the demand. These buyers are perhaps less affected, or have been to-date, by the economic shocks of the pandemic and as such the underlying property market remains strong.
On the converse side, we are not out of the recessionary threat yet as the economy is still exceptionally fragile, or even non-existent, in certain sectors. This, coupled with inflationary pressures and the looming threat of higher unemployment levels, begs the question, will this drag the whole economy into a recession? At this stage, it is difficult to be certain and we will leave this to the economists, but you can be sure that we will keep an eye on the property impacts of the economy for you.
For more residential property data and insight into the UK property market, sign up to our weekly client briefings, where we bring you the latest news and analysis straight to your inbox.