Welcome to our April Homemover Pulse where we take the pulse of the UK property market and give a snapshot of current homemover activity.
UK Property Market Update - April
The housing market is still in the throes of a supply/demand imbalance, with demand far exceeding supply. Whilst there are positive signs with increasing numbers of new instructions, this has not yet translated into calming soaring house prices. Nationwide reported the eighth consecutive month of house price rises in March with annual price growth at 14.3%, the highest level since 2004.
The Current State of the Owner Occupied Property Market
Currently, there are 179,695 residential properties available for sale and 237,512 properties with sales agreed across the country. There have also been 263,619 completions in the last three months. In the chart below, we have broken down these key stages of the home buying journey - new instructions, sale agreed and completions - by region of the UK.
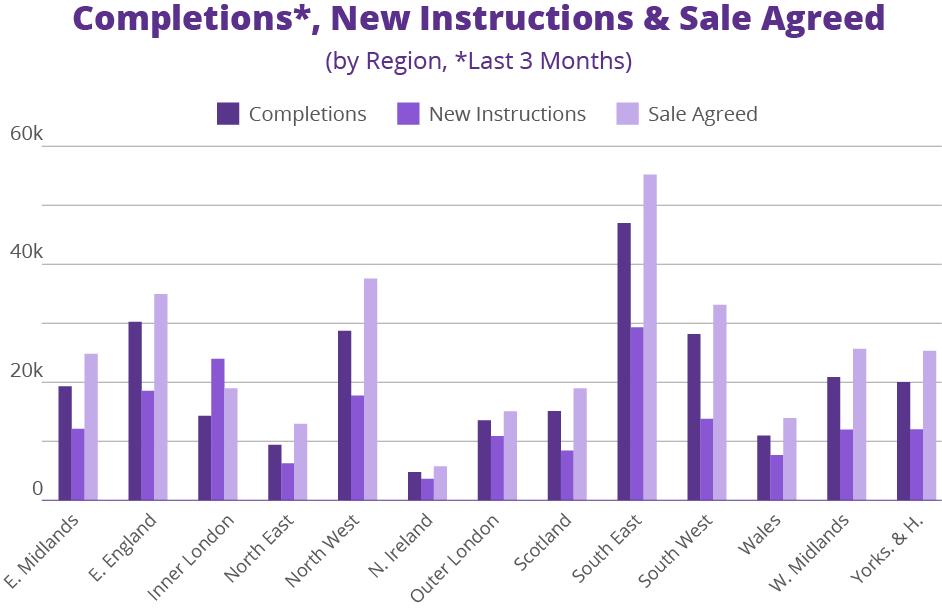
As we can see in the chart, the South East is the region with the most new instructions, sales agreed and completions in the last three months. The region is seeing the strongest property market activity in the UK and, with consistent new instructions, this trend looks set to continue.
Whilst Inner London remains the only region with more new instructions than sales agreed, this gap has narrowed considerably in comparison to the last few months. This suggests that interest in Central London property is on the increase as people return to the city after the exodus that COVID brought.
Perhaps the most striking observation from our April Homemover Pulse is the sharp month-on-month increase in homes in the sale agreed stage of the homebuying process. It looks like moving season has truly commenced, with all areas of the UK seeing notable upticks in sales agreed - in fact, no region saw a month-on-month increase lower than 21%!
Current New Instructions
Our new instructions data covers all residential properties in the UK which are currently available for sale. There are currently 179,695 properties listed for sale across the UK.
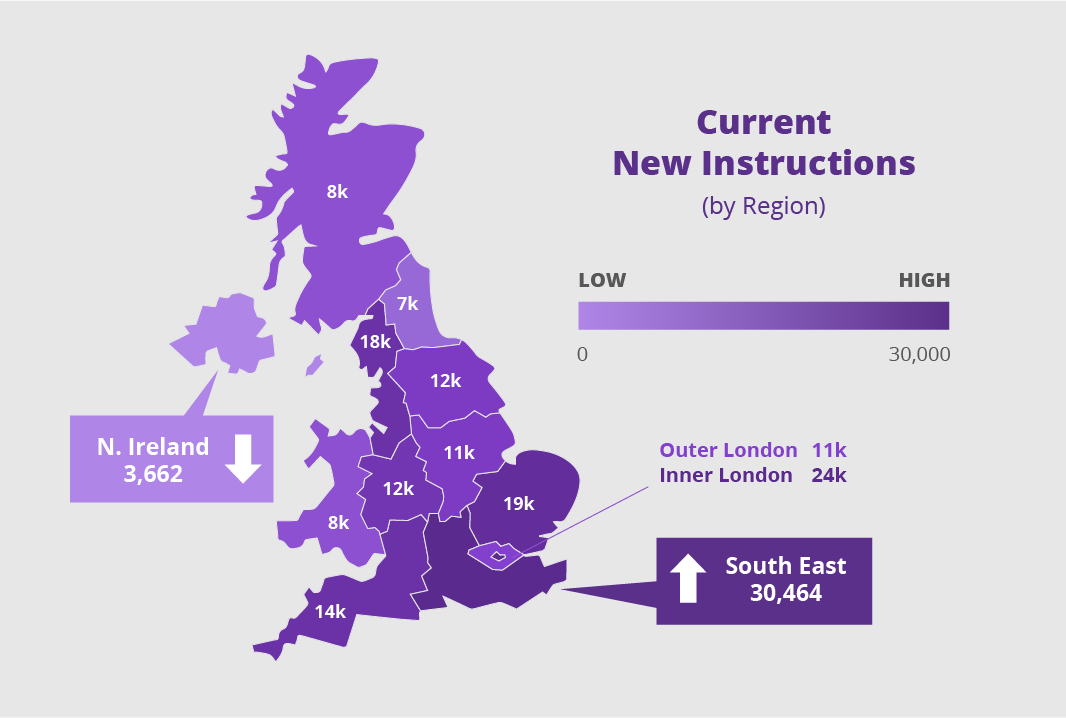
New instructions are a key sign of supply in the property market and so these figures help us understand which regions are seeing more or less fresh stock. Currently, the South East has the highest number of houses currently available for sale, followed by Inner London and East England. When we look at new instructions as a percentage of the region’s households, the pattern remains the same, meaning that the differing sizes of each region isn’t skewing the figures.
With supply so low versus demand, any signs of a supply uptick are welcome. Spring and summer are traditionally the most popular times to move home and so increases in new instructions are somewhat expected due to seasonality. We have indeed seen modest increases in numbers of new instructions across all regions of the UK month-on-month, comparing April and March’s figures. The South West comes in the top spot for month-on-month growth in new instructions, seeing a 7.5% rise. Wales comes next with a 6% month-on-month rise and then the East Midlands with a 5.8% rise. Northern Ireland’s figures have stayed fairly level, experiencing only a 0.4% rise in April.
Current Properties With Sales Agreed
Our sales agreed data covers all properties in the UK which are currently at the start of the conveyancing journey and are sold subject to contract. Sale agreed figures can be seen as an indicator of present demand, showing where people are currently in the process of moving to. Currently, there are 329,681 properties across the UK with sales agreed.
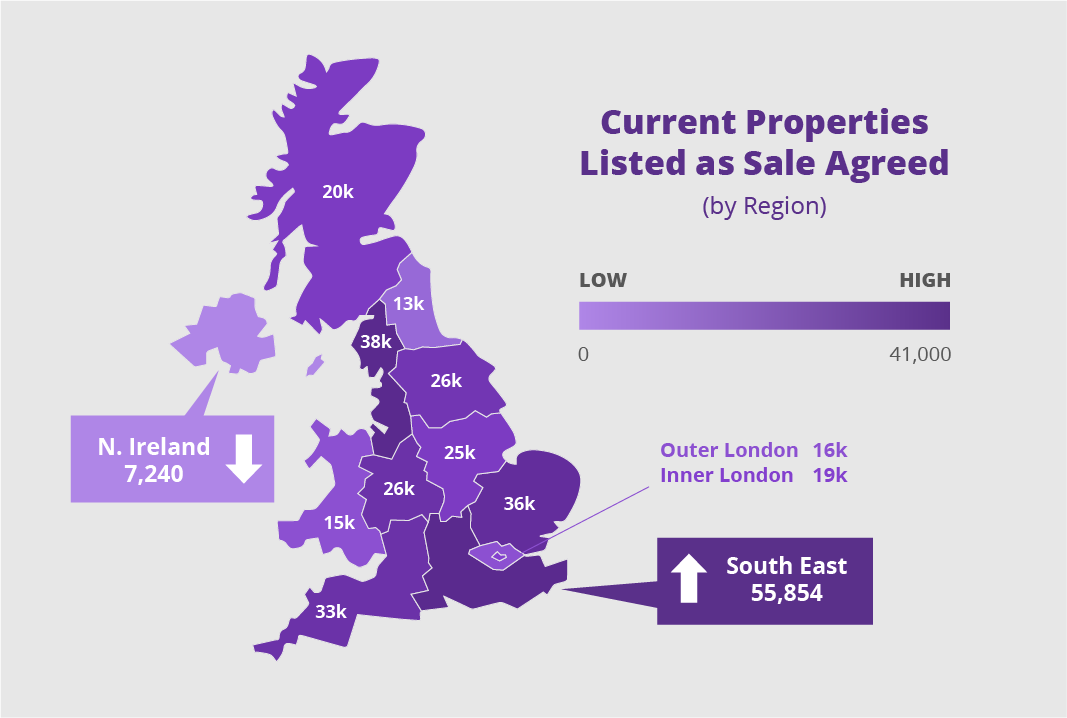
We have seen an impressive increase in properties with sales agreed in April, compared to our March figure. There has been a 39% month-on-month increase in UK properties currently with a sale agreed, showing that demand to move is high.
As noted in our February Homemover Pulse, the average time homes are listed for sale has reduced considerably. This means newly listed properties are moving quickly through the new instruction phase and into the sales agreed phase. Whilst we have seen modest month-on-month increases in new instruction numbers, the large increases in month-on-month sale agreed figures suggests newly instructed properties are selling swiftly, boosting sales agreed figures considerably.
Scotland has seen a dramatic month-on-month change in sales agreed. Despite March seeing low numbers of sales agreed - 5,966 properties - it’s impressive to see that number more than triple to 19,539 in April. Inner London has also seen a large boost with an 81% month-on-month increase in sales agreed, indicative of the rebounding interest in property in Central London.
Completions in the Last Three Months
Our completions data covers all residential properties in the UK which have undergone contract completion in the last three months. This data set, therefore, covers all homes which have been newly purchased and moved into. In the three months to April, there have been 263,619 contract completions across the UK.
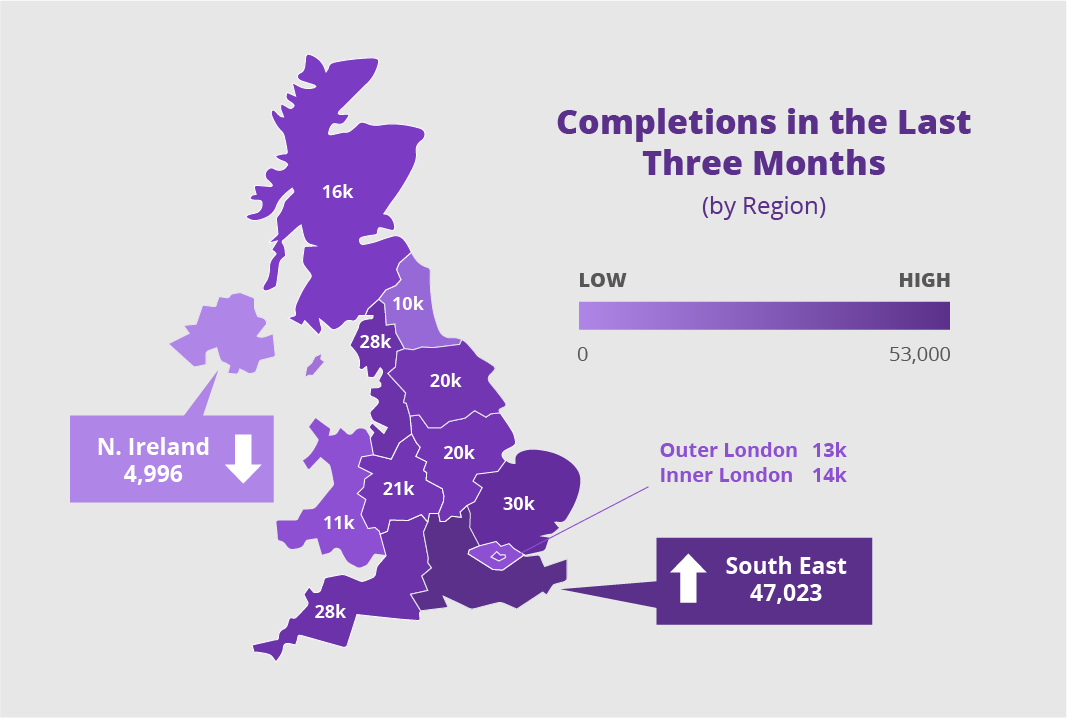
The regions which have seen the most completions in the last three months are the South East, East of England and the North West. When considering the number of completions as a percentage of the region’s total households, the South East, East of England and South West come out top as the regions with the most homemoving activity. These three regions all saw over 1% of their region’s total households move in the last three months.
The homemover audience represents a large opportunity for many businesses, from the retail sector to utilities and insurance. Homemovers spend an average of £42,000 on goods and services related to their move in the months before and after moving house. As property and homemover data experts, TwentyCi can help you tap into this large, high value audience. Get in touch to find out more.